Building Your AI Foundation with Actionable Search Results
This article was originally published on LinkedIn on June 27, 2019.
For the past several years, I've been designing "actionable search results" for enterprise organizations, and some of those organizations are implementing knowledge graphs.
Using knowledge graphs with enterprise search allows you to automatically surface data and insights in one location from across disparate systems. When done right, you get all of the goodies back from all of the systems, in context of how they relate to each other.
This provides workers with immediate access to actionable insights previously only available to those who knew how to query, where to look, how to pick out the pieces that matter, and identify relationships and insights from those pieces. Knowledge graphs with NLP break down those barriers by relating data and allowing users to use natural language to find information.
For example, you could search for:
Fintech startups with $3M in revenue and more than 2 million users
From this query, you could expect to see results returned from various systems: CRM, BI, CMS, chatbots, the internet, emails, and more. From a UX perspective, disparate sources means it is important to normalize metadata and think through the right insights and actions to create an easy, intuitive, and actionable user experience.
Stardog put it well when they said a knowledge graph:
"...lets the enterprise act as if there’s just unified, connected, actionable knowledge."
This is a huge game changer for enterprise organizations and while knowledge graphs have been around for some time, organizations are really just beginning to see their power and drive their adoption.
What's exciting beyond the automation of data relationships and the insights gained is that implementing knowledge graphs can serve as the foundational layer for AI by introducing machine learning into your organization.
How Google Uses Knowledge Graphs
Knowledge graphs can be hard to grasp, but once you know about them, you can find them everywhere. Google uses them, and one you may have seen is the side panel of results you get when you search for a person or company. Google knows there is data all across the internet related to your search that you may find helpful in context, versus as individual results, so they use knowledge graphs to retrieve that data into a collection.
Try searching for "Keanu Reeves" and you'll see images, a bio, movies and more - this is a set of data related to him - but it's not managed data Google owns. They used knowledge graphs to make this happen:
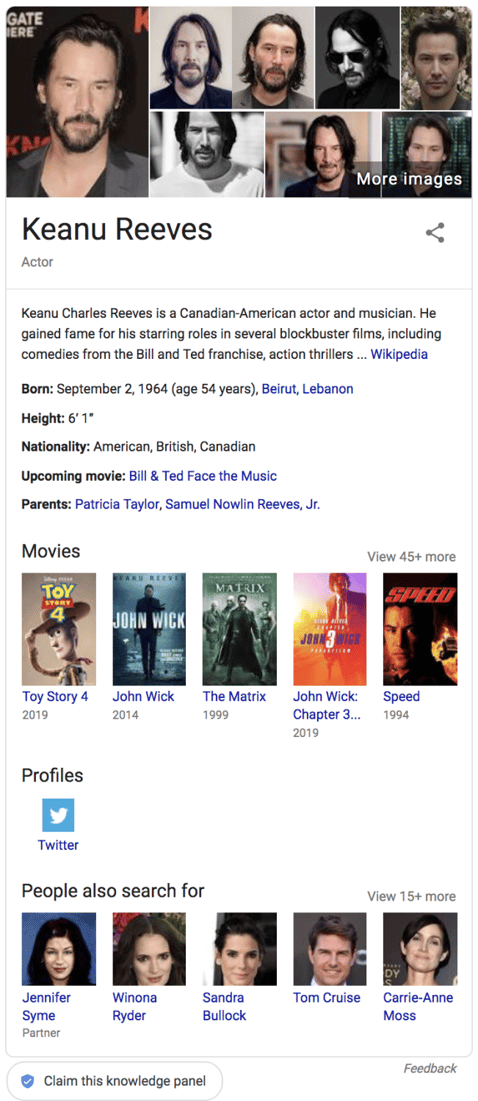
This particular collection of results is appealing and easy to navigate with a large thumbnail of Keanu right at the top. This is no accident. Google has made some assumptions about your intent when searching for Keanu, in this case it looks like they think you most want to see his picture, so they've presented the collection of information to you in a way that is most actionable based on that intent. You may be thinking:
Yeah, but, we're not Google...
...as a client once told me, but you don't have to be Google to see the power of knowledge graphs when applied to siloed data systems in enterprise organizations - and you certainly don't need their budget to do a good job of making search results highly actionable for your users.
The implementation of knowledge graphs requires:
- Strategy
- Ontologies
- Technologies
- Design
- Implementation
This article focuses on the UX part of Design, specific to enterprise search. We'll be working within our team and with our experienced partners to bring you more content on Strategy, Ontologies, Technologies, and Implementation in future articles.
How to Approach the UX for Search
Our approach to UX design for enterprise search is informed by our more than 20 years of experience designing enterprise websites and applications. Our work has extended across verticals like consulting, fintech, healthcare, technology, and more; and regardless of the organization or industry, we've found success with this framework.
There are four core parts to our UX framework:
- Data/Content Analysis
- Business and User Empathy
- Collaborative Prototyping
- User Testing
We start with data/content analysis and simultaneously work on business and user empathy to give us the foundation we need to put the right information in the right place, and in the right, actionable context when prototyping. We conclude with iterative rounds of user testing and updates to the prototype based on our findings.
The UX work when designing for knowledge graphs should include:
- Defining and/or analyzing data sets and associated metadata to include taxonomies
- Defining personas and journey maps
- Defining search result types and the actionable goals and metrics for each
- Rapid prototyping of the experience (low-fidelity wireframes)
- Initial user testing
- Iterating the low fidelity prototype into a high fidelity prototype
- Additional user testing and iterations, as needed
Data/Content Analysis
The first step is to work with your organization to collect an inventory of the types of content and data you have. You're looking for things like video verses news or policies. Once you've defined the types, you'll need to document the metadata that exists for each type. Understanding data and metadata from the bottom-up provides an opportunity to discover what that data is about and determine if any key metadata is missing.
Business and User Empathy
Simultaneously, you should focus on defining who the users are, to include the business, by talking to them to understand their needs, pains, goals, and desires. Document findings into personas and journey maps and let these inform your UX work. We recommend that you don't rush through this process. The final outcome should be a set of core archetypes that represent your users and a journey map for each showing their end to end experiences searching for data and coming up with data relationships and insights.
Prototyping
We like to leverage design thinking in a workshop setting to define the user experience for each type of search result, or "search result type." We find designing in a workshop with business and technology SME's reduces time to approval. Because you'll be working with people across disciplines, it's important to do a primer at the kickoff to make sure everyone has a shared understanding of the work you'll be doing.
Keep things nimble during the workshop. Using sticky notes and whiteboards to design will give you the freedom to change things quickly as new ideas come up.
As you approach doing this work, keep in mind that knowledge graphs return a collection of data that likely differs in terms of its content, metadata, and use - so, you'll need to rally your internal SME's to speak up and contribute their expertise to design conversations. This will help ensure you're designing the right experience for each result type (e.g., contacts, underwriting documents, insights, etc.) because you'll have experts on these types of content in the room to inform your work.
From a UX perspective, the wireframes should aim to:
- Normalize data and show the right metadata for each result
- Provide users with "zero-click" results to get them the data they need without clicks
- Provide users with highly actionable, or transactional, results if you can't do "zero-click"
- Show results in the right hierarchy
- Leverage a topical taxonomy to improve information scent
The UX plays an important role in realizing the value of knowledge graphs to guide users in the discovery of new information and insights that provide a competitive advantage, improves products or services, or improves the internal work environment.
Imagine the power of being able to do a search on your intranet and not just getting data from the content management system, but also from chats, e-mail, a CRM, transactional databases, the news, other content sources, and the company document repository - while also seeing how that data is related with key, actionable, insights.
Presenting data from multiple sources requires a good user experience grounded in user and business needs. This is one place where you can't afford to skimp on the UX, otherwise, the advantages of using knowledge graphs may fall short and you could be risking adoption.
How This Fits Into AI
Starting with a knowledge graph is a great introduction to an AI strategy as knowledge graphs rely on machine learning. This will expose your organization to the value of AI and the knowledge needed to set the course for deep learning where, not too far in the future, an AI-enabled sales tool could be leading your team to delivering far greater value to your customers and your bottom line.
As you move forward in this area, remember that an AI strategy should not only include the user perspective, it should also include a governance structure and governing body who will make decisions about your data and AI strategies and approve changes.