Exploring The Value of Enterprise Knowledge Graphs
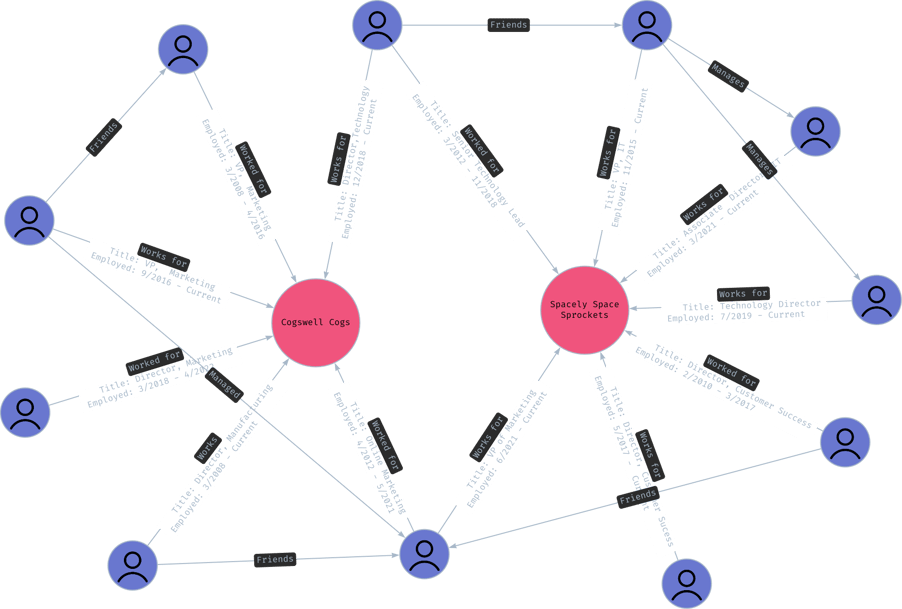
- Knowledge graphs explain relationships between people and assets (data)
- Knowledge graphs complement AI by encoding data, scaling down the need for large data sets
- Knowledge graphs need a business vocabulary to define relationships (an ontology)
Enterprises of all sizes can benefit from knowledge graphs as they help identify valuable links between content and information sources that may not be apparent.
Knowledge graphs are extremely powerful tools that can analyze large amounts of data and provide knowledge that most data management structures do not.
Knowledge graphs complement AI by:
-
- Reducing the need for large and labeled datasets
- Facilitating explainability and transfer learning
- Encoding knowledge in the domain, task, and applications
- Making the black box mechanisms explainable

The term “knowledge graph” was popularized by Google to refer to its knowledge database. Knowledge graphs can be used for anything ranging from search engines, product recommendations, content management, AI, machine learning, and even chatbots.
Knowledge graphs complement AI by:
- Reducing the need for large and labeled datasets
- Facilitating explainability and transfer learning
- Encoding knowledge in the domain, task, and applications
- Making the black box mechanisms explainable
Data is growing faster than humans can keep up, making it almost impossible to analyze and parse data in a timely manner. Knowledge graphs can help enterprises overcome this challenge in the following ways:
1. Ontologies
Knowledge graphs can represent an organization’s business vocabulary in an ontology to identify relationships between entities that help organizations make sense of their vast data points.
2. Efficiency
By filtering and recommending relevant information, knowledge graphs improve efficiency in content management and provide even more personalized search features.
3. Unified Data
Knowledge graphs provide a unified view of data by combining data from different sources. For instance, financial companies may need to integrate internal customer data and data from third-party sources to get a holistic view of their customer’s financial situation. They can use this information to assess the person’s default risk while approving their loans. Further, they can share this data with their customer to let them know the reason for their decision. This ensures complete transparency between the financial companies and their customers.
4. Data Processing
Many industries, such as healthcare and financial services providers, get raw data in their organizational units. The vast amounts of data make it difficult for humans to make sense of and process that kind of information. Knowledge graphs can be coupled with AI and machine learning for automated data management, fraud detection, chatbots, recommendations, search, and data governance to take the burden from human employees and simplify the entire process
5. Data Context and Explainability
One of the critical issues concerning artificial intelligence technologies is the lack of data explainability. Users cannot understand how a particular solution was reached or how a problem was approached. An appropriate explanation is needed in many industries, including credit and loan decisions, fraud detection, parole decision, or any other decision where the result produced directly affects a person. Knowledge graphs supply context by describing the relationships between data points. Since knowledge graphs identify relationships between all involved entities, they can be beneficial for making the black box mechanisms explainable. They have the potential to add more transparency to the artificial intelligence process of decision-making.
At Predictive UX, we focus on UX to provide better business outcomes for knowledge graph projects. We employ a user-first framework for extracting greater value from data and knowledge graphs. It is critical for enterprise organizations to work collaboratively with users, data consumers, business leaders and data experts in a practice called Design Thinking to ideate, design and test knowledge graphs.
Design Thinking is a UX method for collaboratively and iteratively designing data solutions based on user needs and user testing. It puts the business, data experts, data consumers, and users up front by defining user journeys and pain points on the front- and back-end of systems to tie app and data flows to business-specific outcomes. Leveraging this approach puts companies in a position to reap greater returns and to nurture the health of their knowledge graphs. Learn how Predictive UX can get your knowledge graph projects on track with our 6-week Data Accelerator so you can deliver the value to your users, consumers and business leaders.
Authors' Note: I focus my writing on data challenges and finding solutions to make data findable, easy to use, and actionable. If you have an interesting data project, challenge or solution, that you would like me to highlight in these posts, please reach out.
.jpg)


