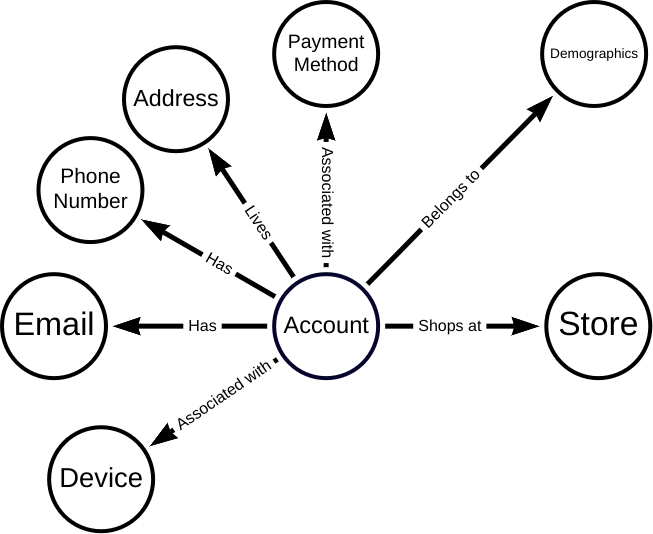
A knowledge graph in its simplest definition is a behind the scenes relationship manager that describes how stuff is connected on a small or massive scale. When coupled with machine learning knowledge graphs become a living source of connections between seemingly unrelated stuff from different systems, even from different companies.
While a knowledge graph is a behind the scenes operator, they surface information to various types of UI’s and it really needs to be designed with a focus on the people, or users, who will be consuming the information and data. Understanding user needs is how relationships between multi-sourced information can become not only meaningful, but also insightful and, importantly, actionable for employees and customers at exactly the right moment.
Applied on a small scale knowledge graphs can address knowledge loss from employee attrition. It can remove the panic when DBA Dave left the company last month but he was the only one who knew how to pull together all of the data from all of your different systems to create your board report. On a larger scale, it can be applied to solve problems like cleaning up the environment.
Knowledge graphs are a common underpinning to search to help users get contextually relevant results based on user intent. So for example, when I search for Elon Musk, I get not only the person, but also his companies, tweets, recent news, people related to Elon Musk and more. Now for me, that’s a good experience, but I think knowledge graphs when applied to a deeper understanding of user intent can be even better. So if I have a specific use case in mind and I am trying to solve specific problems, then my knowledge graph can be used to surface the information that’s really relevant for a specific scenario. For example, knowledge graphs can power recommendation engines, as well, like what training course you should take next or what medical diagnosis to consider based on patient data from the current visit and patient history. They can also reveal underlying patterns in data, saving companies from repeating costly mistakes.
Knowledge graphs are really most powerful when coupled with understanding users which means considering their intent, needs, goals, language and what they want from connected content and data experiences.
Most of the time knowledge graphs and data projects are really focused on the data itself and that's fun and exciting but, again, talking to users is really what's going to make that knowledge and data and all of the connection of that information valuable at the end of the day.

Text transcript from Steve's answer to this question:
I define a knowledge graph as the application of a common understanding to data stored in a graph structure. This application of a common understanding enables us to analyze and query massive amounts of data efficiently. That is the real power of knowledge graphs.
Over the past 20 years, knowledge graphs have made tremendous strides in helping to organize data, surface data, store data, make data more accessible and more recently the ability to apply machine learning to the data.
There has been a tremendous amount of interest in knowledge graphs, but we may have lost sight of the end user. If the Gartner HypeCycle is any indication, knowledge graphs are at the precipice of the “Trough of Disillusionment,” and I strongly believe the end users, data consumers and business leaders are the keys to getting us through the “Trough of Disillusionment” and onto the path of the enlightenment. And I am excited to lead the KG community through this disillusionment and into enlightenment, hand in hand with the users, data consumers and business leaders working with knowledge graphs today.


