- Knowledge graphs are easier than ever to get off the ground
- Expertise, resource constraints, change management, tribal decision-making, data access and scaling contribute to the "trough of disillusionment"
- Focusing on the end users of the data, the data consumers and the business leaders will help you overcome these challenges
Knowledge graphs are at the peak of inflated expectations.
According to the Gartner Hype Cycle for AI, 2021, Knowledge Graphs are at the “Peak of Inflated Expectations” and will soon enter the “Trough of Disillusionment.”
The 6 issues leading to the “Trough of Disillusionment”
Knowledge graphs are not new, they have been around for decades. The definition of a knowledge graph is becoming more widely understood, and how to build and implement a knowledge graph is well documented. A lot of interesting and exciting use cases are floating out there.
It’s become a lot easier and cheaper to quickly stand up a knowledge graph, and they are attractive to many organizations as a foundational layer for implementing AI. For these reasons, there is a lot of interest in knowledge graphs, but once a knowledge graph project gets off the ground, major organizational challenges quickly appear making the “Trough of Disillusionment” readily apparent. I believe knowledge graphs will enter the “Trough of Disillusionment” for the following organizational reasons:
- Expertise: In order to build an enterprise knowledge graph, you need to find experts in data visualization and UX, graph databases, data science, knowledge management and product management. And even if you build the right team, the current talent war makes keeping a team intact difficult. We recommend four strategies to overcome this: working with vendors who offer pre-established teams of hard-to-find talent, hiring fractional resources for just-in-time work, hiring recent college graduates you can mentor into some of these hard-to-fill roles, and talking to your vendors about being able to hire their resources when the project concludes.
- Dedicated Resources: If you decide to rely on a vendor to build your enterprise knowledge graph, you simply won’t be connecting a few API’s, integrating a few third party tools, setting a data pipeline or two and calling it a day, you will need an internal dedicated team of data resources, subject matter experts and tech resources to work with the vendor and your internal data stakeholders to collect, understand and help integrate data into the vendor solution. If you don't have those resources readily available, empower your vendors by paring them with executive sponsors who enable them to work on their behalf and take on a critical leadership role in your organization.
- Behavioral Change: Whether we want to believe it or not, teams develop workflows and workarounds within and outside their data solutions. These team specific data workarounds and workflows will need to be accounted for to extract the greatest value from a knowledge graph. While it's great to build a knowledge graph with connected data, if you can’t use it to help optimize enterprise workflows it becomes a data warehouse and an eyesore on the budget. To overcome behavioral blockers, do user research and document potential pitfalls in process and operational changes and then plan for those challenges with change management as part of your data strategy.
- Tribal Decision-making: Tribal Knowledge, or as I like to call it - “tribal decision-making”, is very real. One group will make a decision on data, while another group will make a different decision based on the same data. Inherent in the idea of building a knowledge graph is that it will have to account for different types of knowledge within the organization. That's where Design Thinking and understanding user needs plays a critical role in addressing how to present the right data, in the right context, at the right moment in the user journey. Research-backed decisions coupled with user testing are hard to argue against. It focuses decisions around proof points versus opinions.
- Data Access: Enterprises are complex, finding data, getting access to the data and eventually understanding data is a herculean task within a large organization. Enterprise organizations need to be prepared to invest time with their vendor partner to uncover what data exists, to normalize or create metadata for it, sunset or update data, and ultimately define access and governance strategies. Make sure to ask your vendors if they can help you collect, analyze, define and update your enterprise data.
- Scaling: Small pilot projects with a few data sources showing the potential of knowledge graphs are an important first step, but the complexity of data collection, pipelining, integration and presentation make scaling infinitely more difficult. Scaling doesn't always have to be a multi-year effort. Technology is constantly changing and enterprises need to be ready to create a living roadmap to help them scale effectively. A good scaling strategy doesn't die on the vine when technology changes. Make sure your roadmap reflects this mentality and socialize this well within your organization so it doesn't catch anyone off-guard if the roadmap isn't followed precisely.
Why Users Are at the Root Cause of Data Fails
All of these organizational challenges will not be easy to overcome and most organizations will be disillusioned after getting their knowledge graph project off the ground if they aren't taking some of these actions. Some will even abandon their efforts. However, the biggest factor we see in enabling organizations to overcome the “Trough of Disillusionment” and get to the “Stage of Enlightenment” is to focus on the end users of the data, the data consumers (human and non-human), and the business leaders with a stake in the project.
We find most data projects fail from a mix of end user, data consumer or business leaders left out of the picture. In knowledge graph projects, the end users and business leaders cannot be left out, when they are, you end up with a cool technology that can do amazing things, but doesn’t create the insights, knowledge or business outcomes to justify further investment. Design Thinking combats this. It enables organizations to ideate, design and test knowledge graphs to find a path through the “Trough of Disillusionment.”
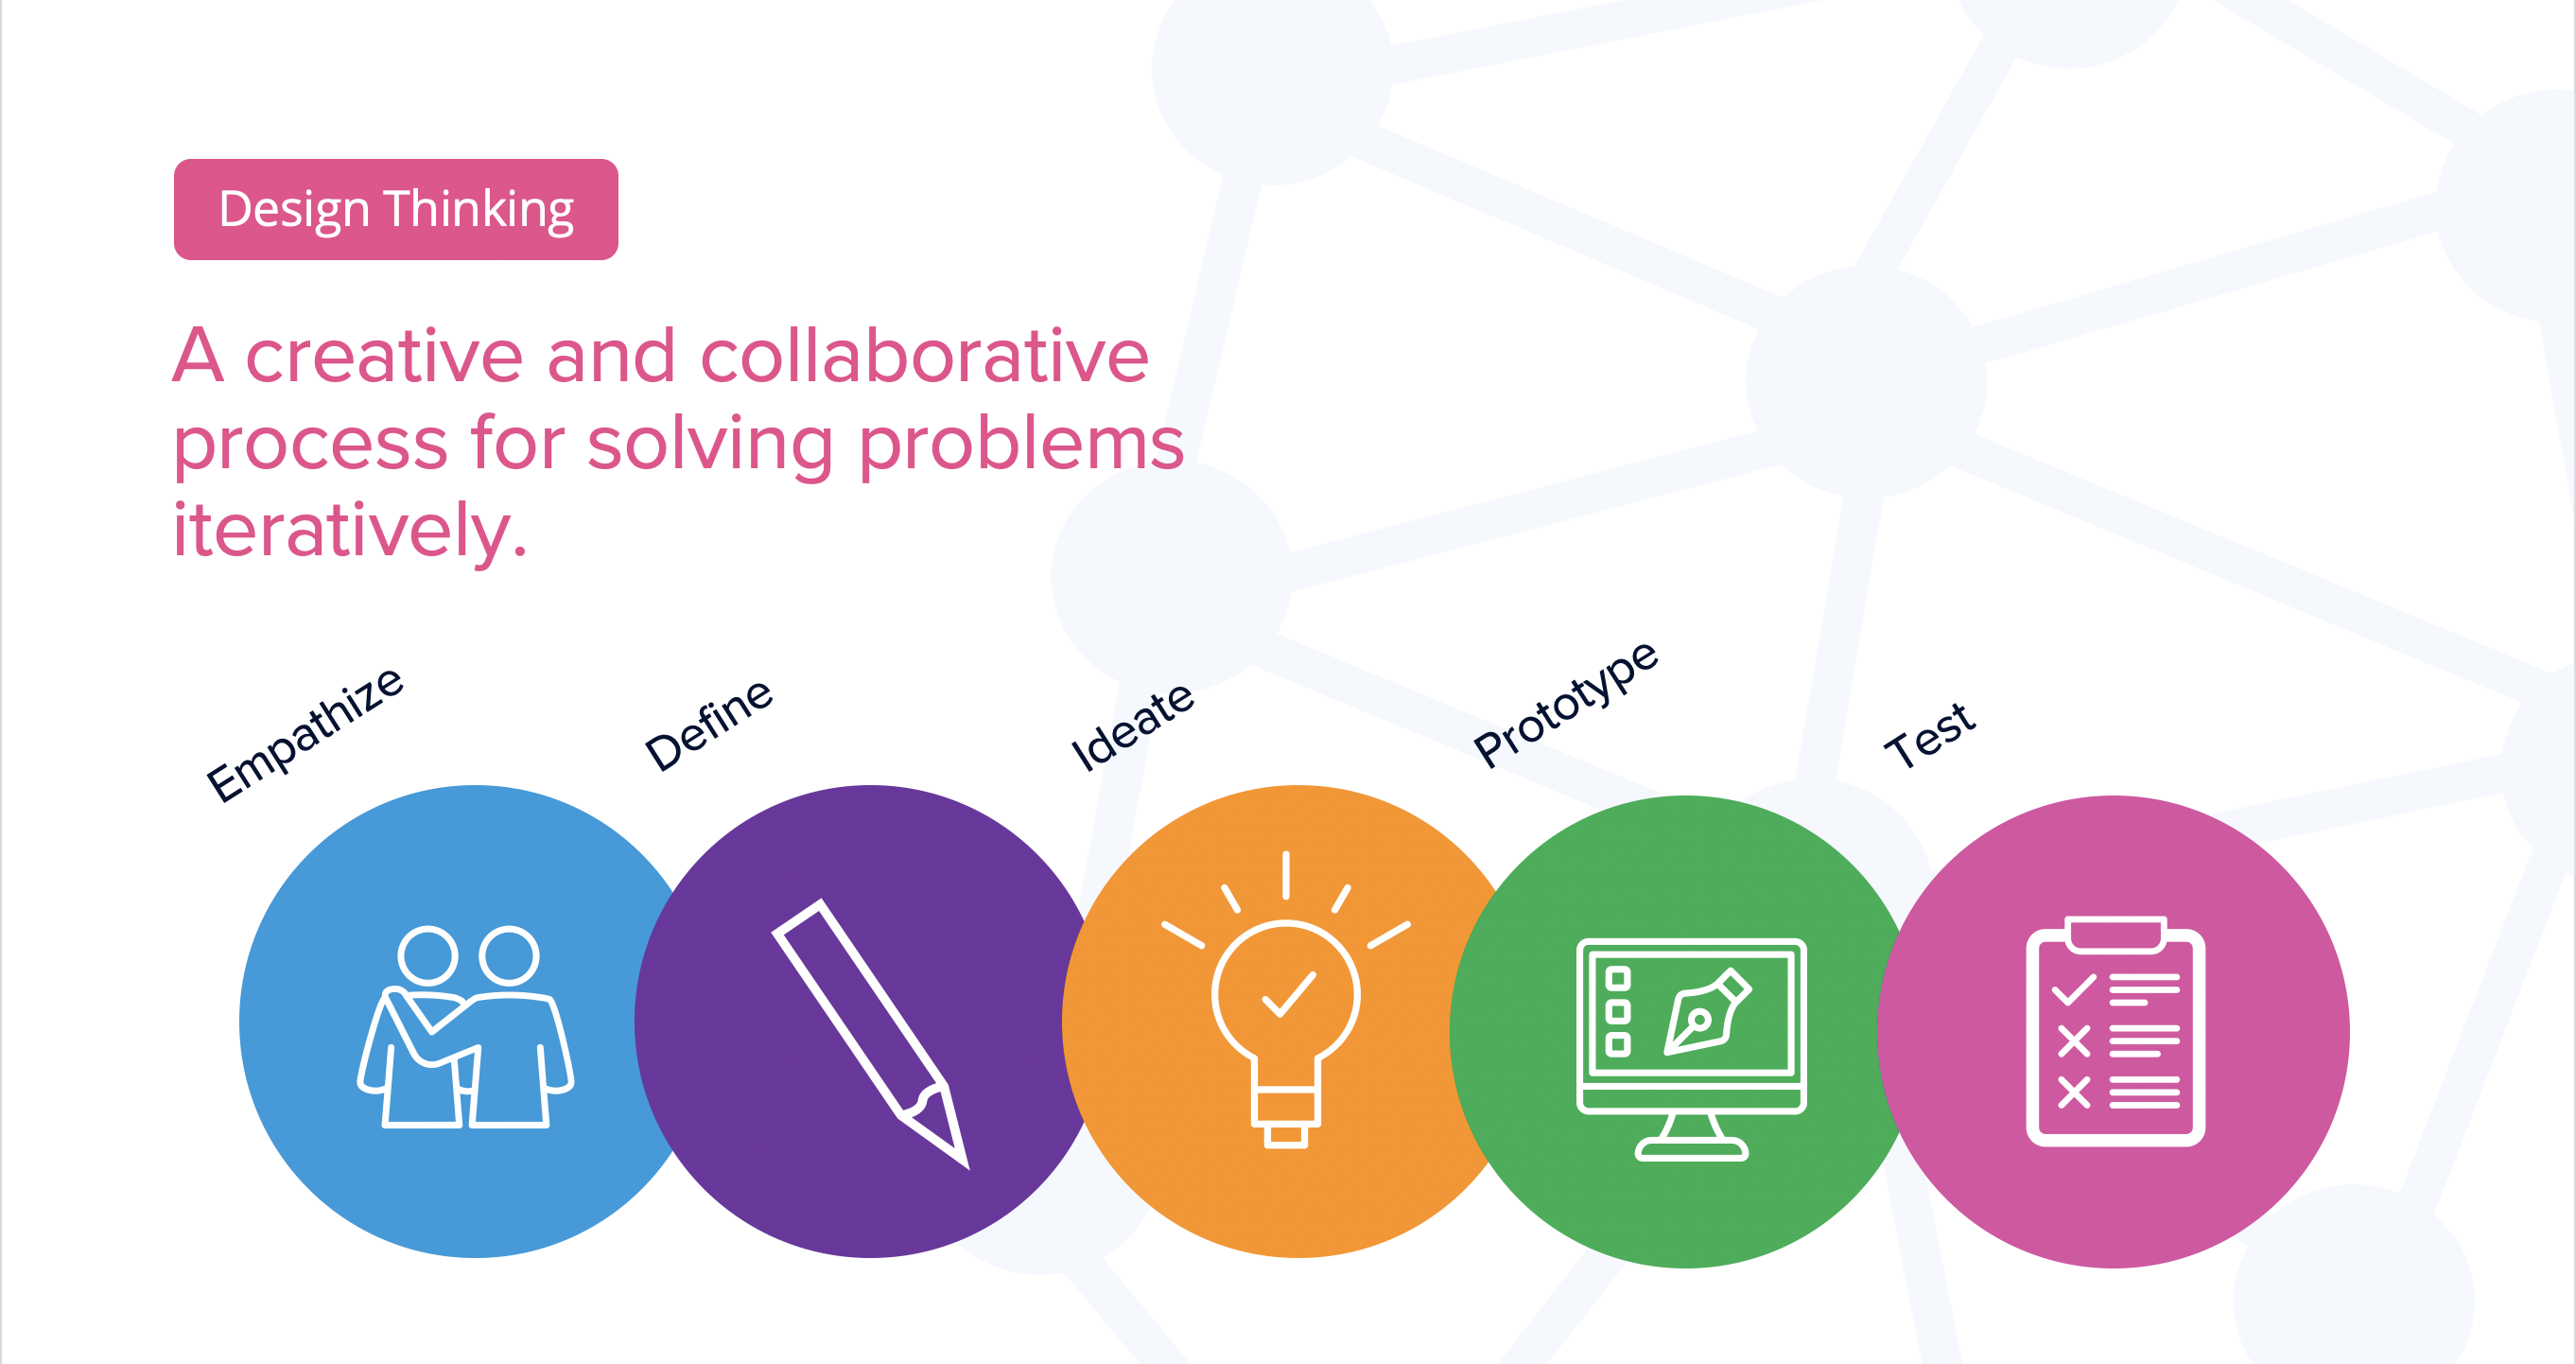
Design Thinking is a UX method for collaboratively and iteratively designing data solutions based on user needs and user testing. It puts the business, data experts, data consumers, and users up front by defining user journeys and pain points on the front- and back-end of systems to tie app and data flows to business-specific outcomes. With this focus the knowledge and insights created by knowledge graphs can be directly linked to business value. When the knowledge and insights created by a knowledge graph relate to business outcomes, you will start the climb up the “Slope of Enlightenment.”
Take This Approach
Predictive UX’s 6-Week Data Value Accelerator program helps you get a handle on what you need to do to create the alignment between your knowledge graph projects and the business value they need to create to start the climb up the “Slope of Enlightenment”. The program focuses on user-first principles and business outcomes. The 6-week engagement combines Design Thinking with Data-driven Design in a unique knowledge-centric methodology to put users first in the delivery of actionable data insights. Our approach gives knowledge workers the information, data consumers governance, and business leaders the value they need. Talk to our Data Practice Lead to learn more.
.jpg)